Get a Growth Scan
First Account · 90-Day Breakdown
Tieralia: the first 90 days.

A summary of reported performance and operational changes during Tieralia’s first 90 days with Circes.

Tieralia

Tieralia was the first account managed with Circes and is owned by one of Circes’s founders. This case study covers February 26 to May 21, 2026. It summarizes historical account results, not a live dashboard or a forecast.

Why we built Circes

We saw the need for more than another tool.

Circes started with the operational challenges of Tieralia, a business owned by one of our founders. A stack of tools and a virtual assistant still left important questions about how effectively the business was running.

Even chatbots connected to those tools needed someone to coordinate the work and keep supplying context. The daily checklist created plenty of activity, but little clarity about which decisions mattered.

We built Circes around that need: a team of specialists that understands the business, learns alongside its operators, and helps them focus on growth.

Since adopting Circes, the Tieralia team reports clearer decisions, cutting loss-making SKUs, and getting 10 hours a week back. That time went into launching a new product with confidence.

The Tieralia team’s reported experience using Circes since launch. The historical performance figures below cover the separate period shown.

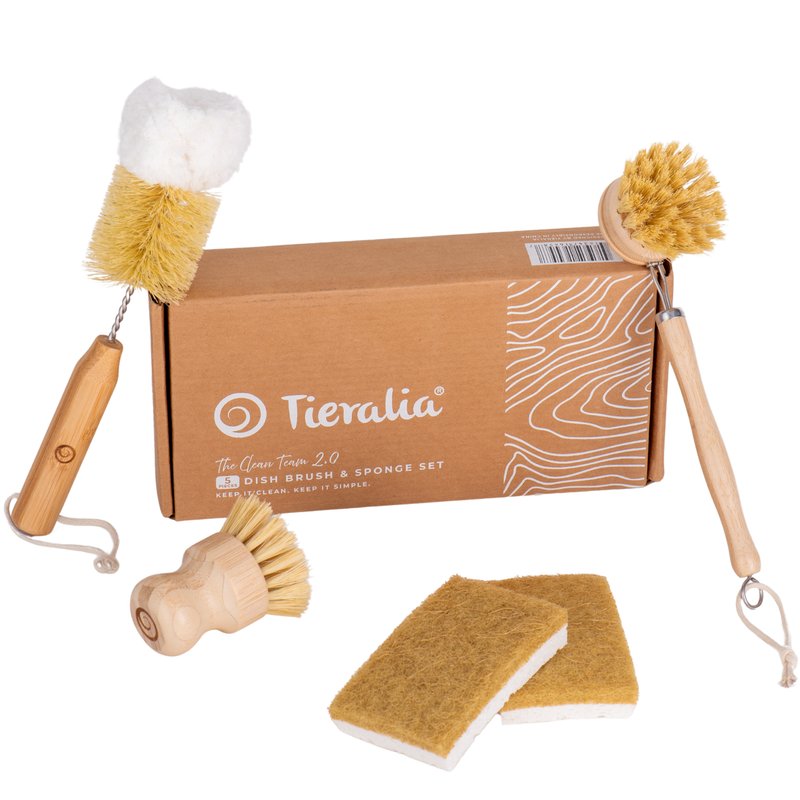
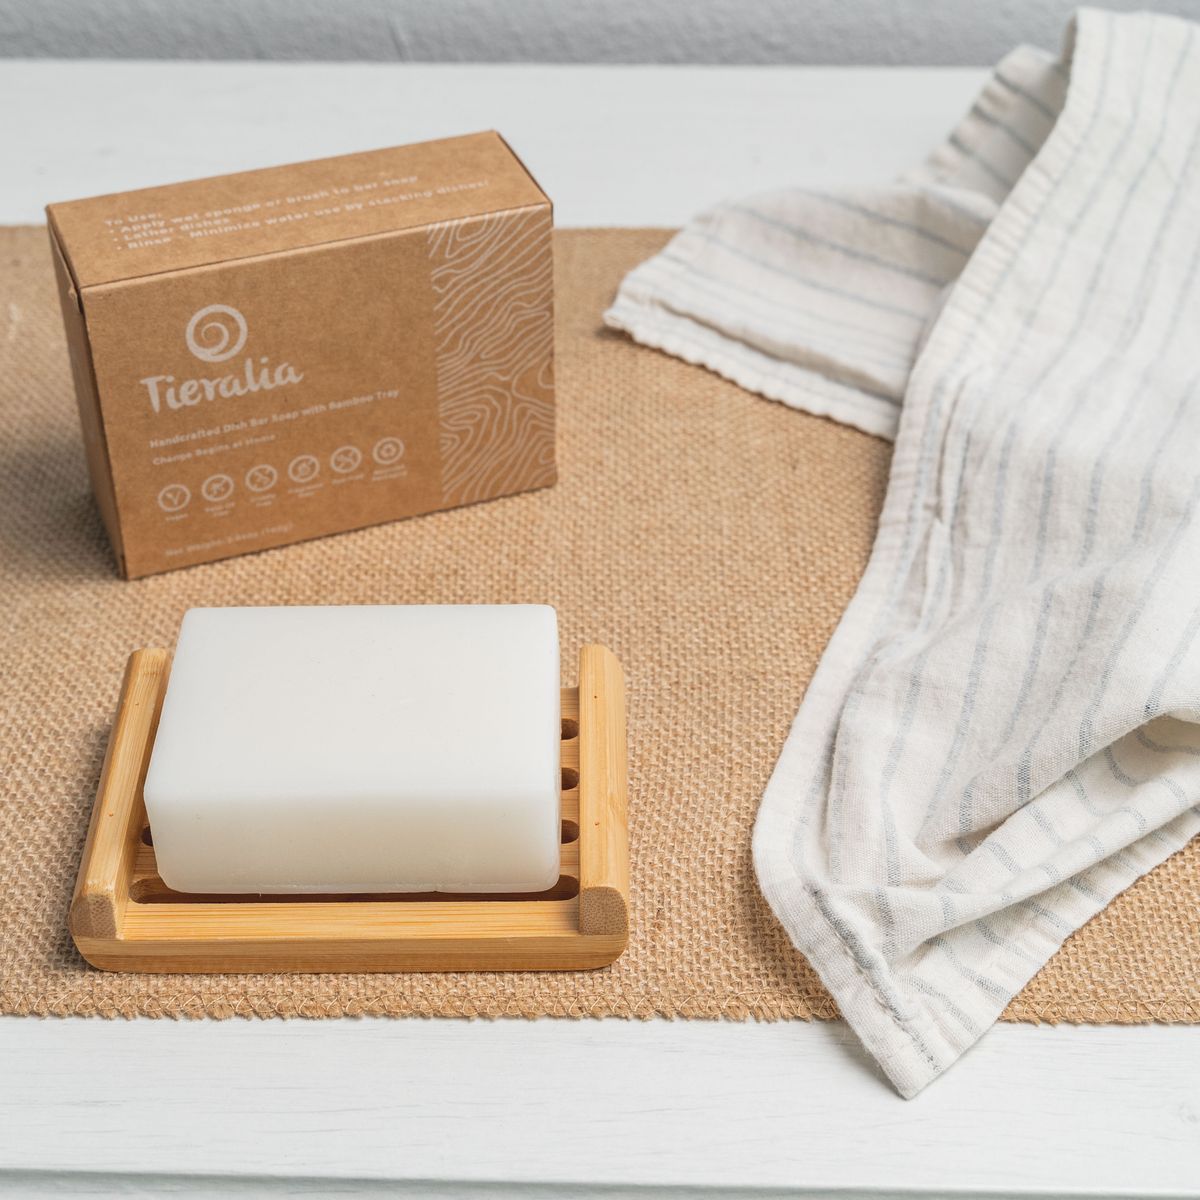
Tieralia handcrafted dish bar soap Tieralia Clean Team dish brush and sponge set
90-day results · historical results
Feb–May 2026
TACoS
37% 16%
↓ 57% over 90 days
Organic share
~27% 59.5%
↑ organic now majority of revenue
Ad spend
Cut 37.5% in month 3
Revenue
Grew +21.4% the same month ad spend was cut
Net profit
2.3x vs prior 60-day period
200 recommendations applied · 5 campaigns retired · 43 wasteful keywords blocked.
Selected changes during the study
Study period
200
Recommendations applied
Across PPC, inventory, and budget reallocation during the reporting period.
43
Wasteful keywords blocked
Search terms identified as unprofitable and excluded from targeting.
5
Unprofitable campaigns retired
Campaigns above break-even ad cost were retired, with spend redirected to stronger-performing campaigns.
−37.5%
Ad spend cut · Month 3
Revenue grew +21.4% in the same month that ad spend fell. These changes alone do not establish cause.
82%
Recommendation accept rate
The share of recommendations accepted during the study. Acceptance measures adoption, not whether an action succeeded.
59.5%
Organic share of revenue
Up from ~27% at baseline. Organic now the majority of brand revenue.

Source   Based on Amazon seller and advertising data and Circes account records for Tieralia, Feb 26 – May 21, 2026. TACoS is advertising spend as a share of total sales; 37% to 16% is a 21-percentage-point decline, approximately 57% relative. The reported net-profit multiple compares a 60-day period with the preceding 60 days, rather than the full 90-day study; new-SKU revenue is excluded from the comparison base. Request the exact comparison windows, cost treatment, and methodology for a detailed assessment. These are results from one founder-owned brand, not an independently verified study or a prediction for other accounts.

Want more detail on the reporting periods, calculations, or decisions behind these results? Drop us a line.